
Elevating SEO Analysis with Google Search Console and BigQuery
I have partnered with some other amazing SEO and analytics specialist to create an online course for BigQuery for SEOs. We use Google Search Console’s raw data to show you how to get more out of the raw GSC data set.
Google lets you export your raw data from Google Search Console to BigQuery. This is exciting, as it opens up a world of possibilities for you to dive deeper into your search analysis and combine search data with other data points. This article shows some ways it can be used. And since I'm a huge Fast and Furious Fan, I'm using dummy FF data as my sample.
Why BigQuery
BigQuery can enhance your SEO toolkit:
Unlimited data retention beyond Google SC’s 16-month limit
No row limits — every query, every click, every impression
Complex SQL analysis at scale
Easy joins with GA4, CRM, or other datasets
BigQuery lets you supercharge your SEO with speed, scale, and flexibility — without blowing up your server.
How to connect GSC to BigQuery?
To set up the Bulk data export for Google Search Console data to transfer to Big Query in Google Cloud, follow the instructions here: https://support.google.com/webmasters/answer/12917675?hl=en
Set up a project in Google cloud. Note down your project id to use in Google Search Console.
If you already have a project and are storing data in Big Query, make sure that the dataset location you set up in the search console is the same as the other datasets you have in Google Cloud and BigQuery. As you are unable to query across locations.
Starting with the Basics
Now that we have everything set up, you will need to run SQL Queries on the data sources to access it.
We will begin with a basic query of the Google Search Console data.
SELECT
  query,
  impressions,
  clicks,
FROM your_project.your_dataset.searchdata_url_impression`
This query gives you data like this:

The problem with this is:
The raw data contains “anonymised searches” so it comes up as null in the table
It also contains duplicates for different days, different regions, and different devices
Grouping data
So, we need to use a group by:
    SELECT
      query,
      sum(impressions) as impressions,
      sum(clicks) as clicks
    FROM your_project.your_dataset.searchdata_url_impression
    where query is not null
    group by query
    order by impressions desc
Which gives you this:

This is more useful as we remove nulls, group the queries, and order by impressions. However, you're still not doing more than you can achieve with Google Search Console.
Branded vs Non-Branded Keywords
Let's expand it further to include branded vs. non-branded queries.
SELECT
  data_date,
  query, url,
  case when regexp_contains(query, "fast & furious") or regexp_contains(query, "fast and furious") or regexp_contains(query, "toretto") then "Branded" else "Non-branded" end branded_vs_non_branded,
  sum(impressions) as impressions,
  sum(clicks) as clicks,
  sum(clicks)/sum(impressions) as CTR,
  1+round(sum(sum_position)/sum(impressions),2) as avg_position
FROM your_project.your_dataset.searchdata_url_impression
where query is not null and not(is_anonymized_discover)
group by all
order by data_date desc
Which gives you this:
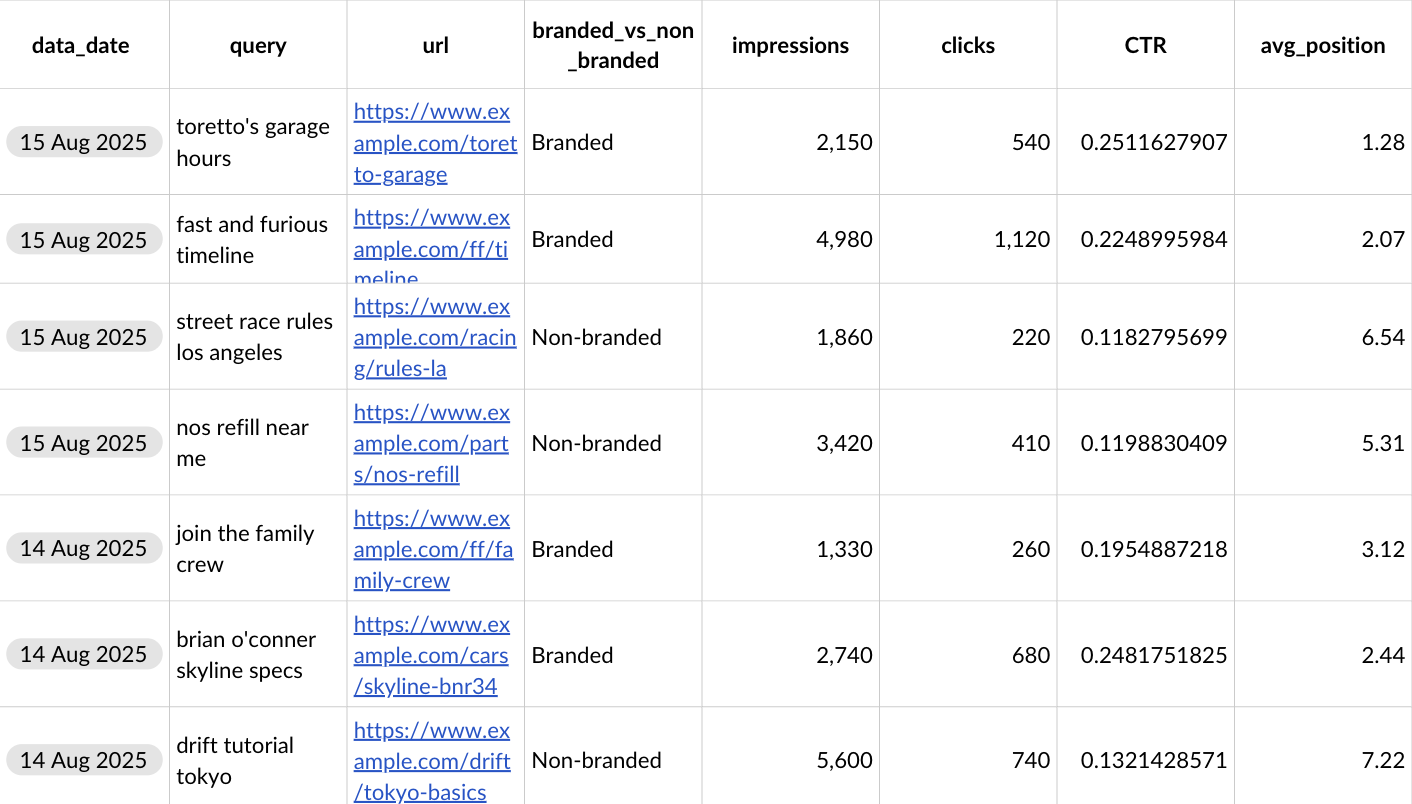
And with this data, you can show:
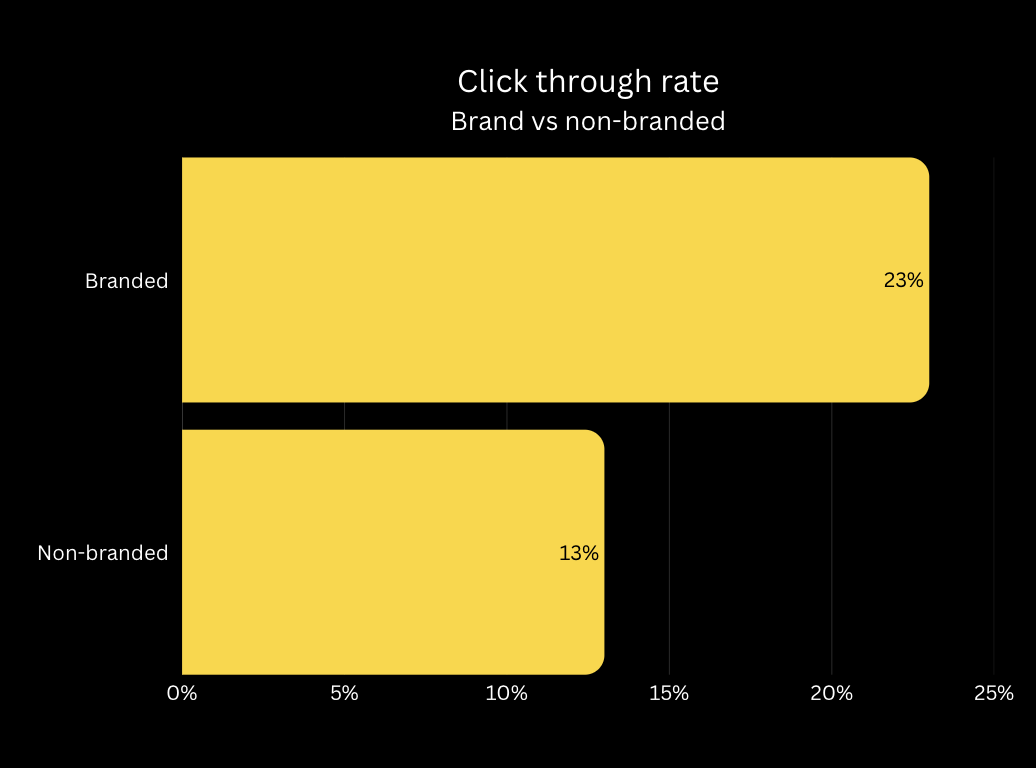
Branded vs Non-branded Search Queries Click-through rates and Average position
Grouped impressions over time

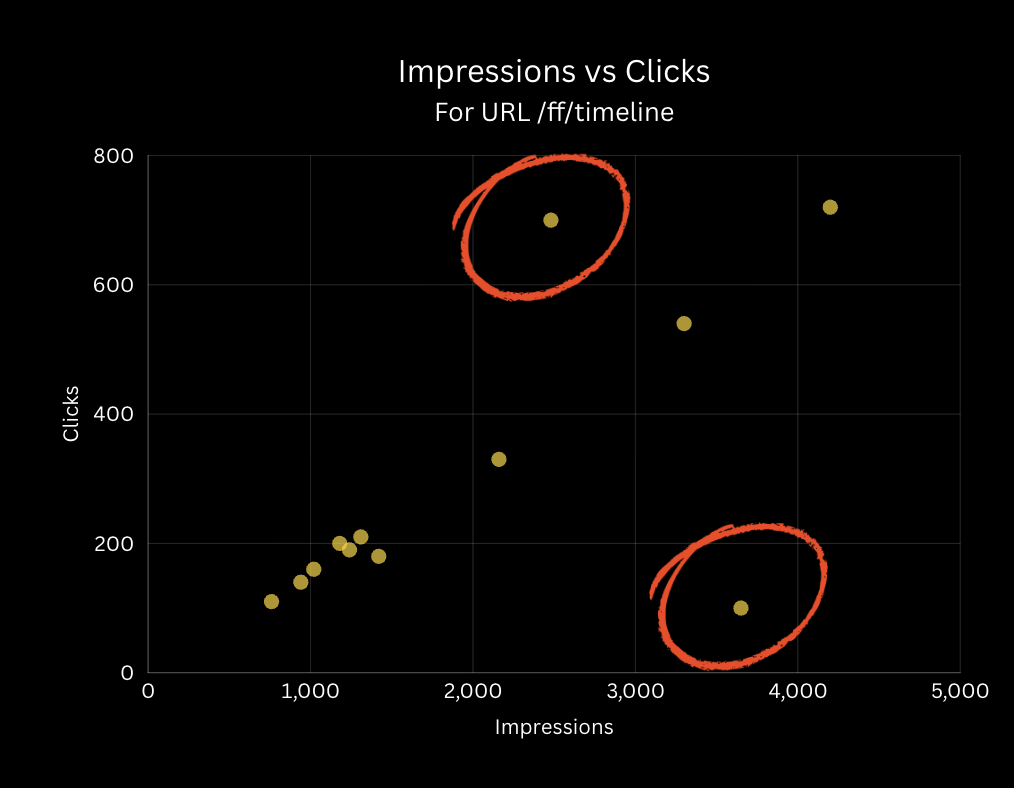
Deep dive into all keywords for a URL.
You can connect this data with Google Looker Studio to display it in data visualisations.
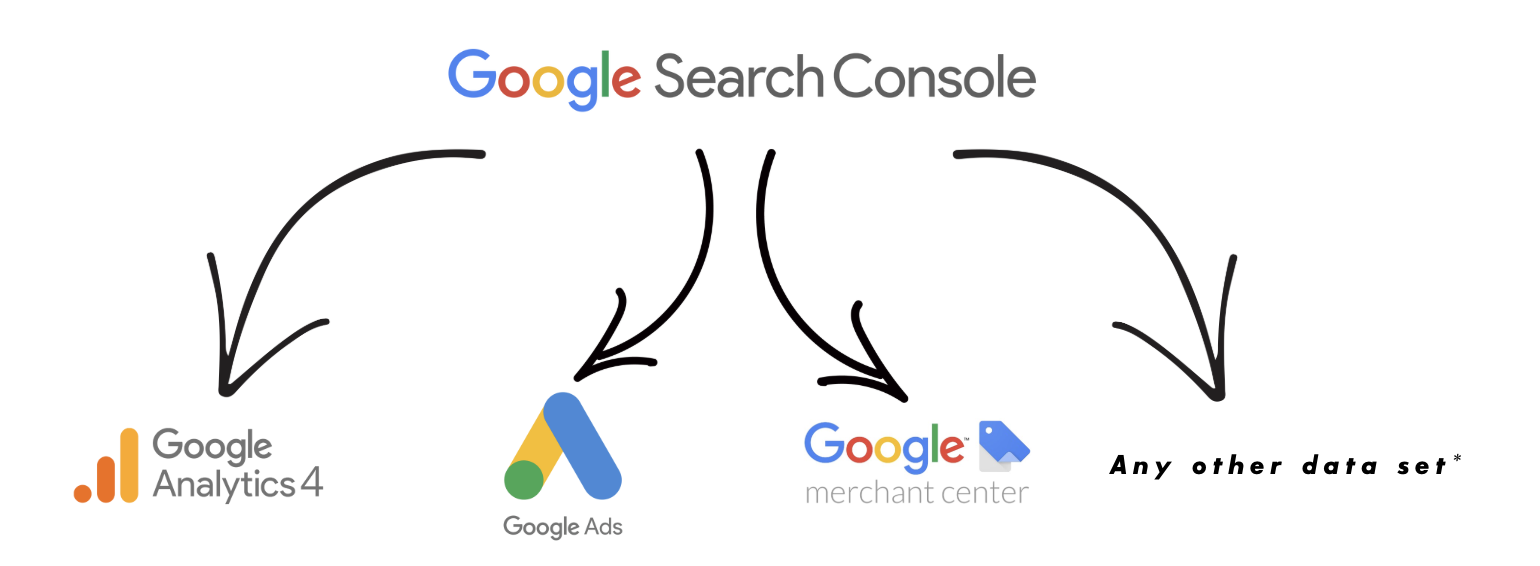
Bringing Data Together
The beauty of BigQuery is that you can use it to combine with other datasets. Most Google products, like Google Analytics, Google Ads and Google Merchant Centre, allow you to export the raw data to BigQuery. On other platforms, like Screaming Frog or Meta, you can use APIs to get the data in there.
SELECT
  url,
  STRING_AGG(DISTINCT query) AS queries,
  SUM(impressions) AS impressions,
  SUM(clicks) AS clicks,
  CONCAT(ROUND(SUM(clicks) / SUM(impressions) * 100, 2), "%") AS CTR,
  1 + ROUND(SUM(sum_position) / SUM(impressions), 2) AS avg_position,
  SUM(sessions) AS sessions,
  CONCAT(ROUND(SUM(session_engaged) / SUM(sessions) * 100, 2), "%") AS engagement_rate,
  ROUND(SUM(total_engagement_time) / SUM(sessions), 2) AS avg_engagement_time,
  SUM(coronas) AS coronas_drunk,
  SUM(quarter_miles) AS quarter_miles
FROM your_project.your_dataset.searchdata_url_impression AS gsc
LEFT JOIN your_project.your_dataset.ga4_data AS ga4
  ON gsc.data_date = ga4.date AND gsc.url = ga4.landing_page
GROUP BY url
ORDER BY impressions DESC
This code combines Google Search Console data with Google Analytics data. The GA4 dataset has already been filtered to include only users who came from organic search.
It combines the two datasets on a URL/landing page and date. This allows you to get conversion rates for landing pages of search traffic. Here, I have decided that a FF conversion is drinking a Corona or driving a quarter mile.
The type of join is called a left join, which means you keep everything on the left (search console data) and only include the data that matches in the right table (Google Analytics data), as shown in blue in the diagram below.

This query gives you data that looks like this:

Which gives you the ability to find insights like:
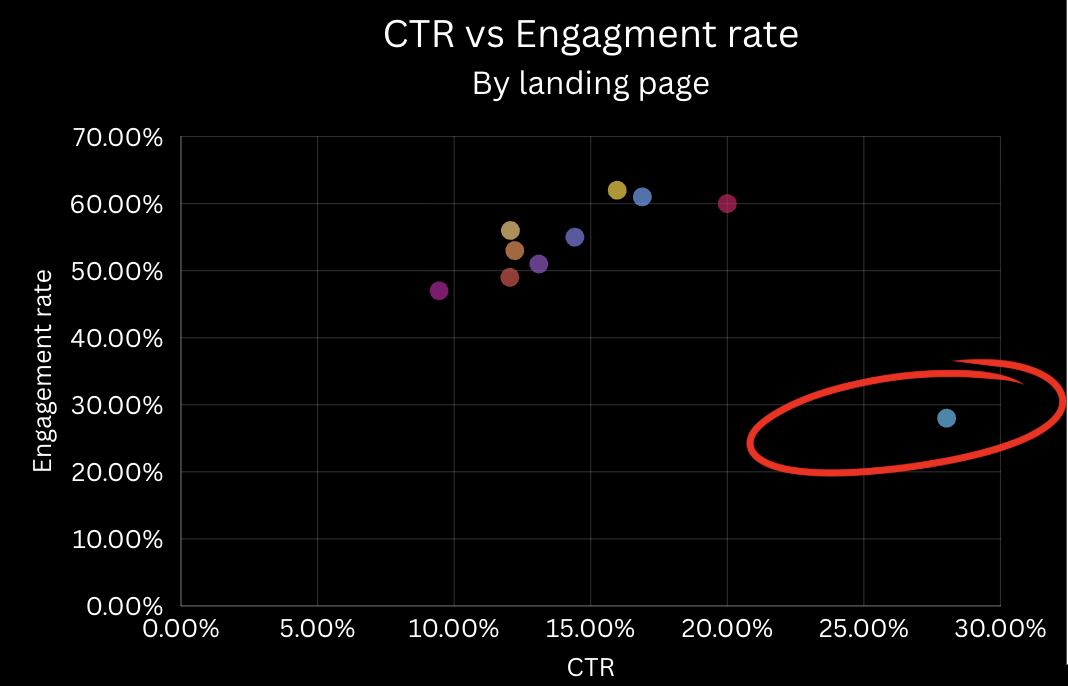
Landing page CTR vs Engagement rates
Impressions by conversion rates for URLs

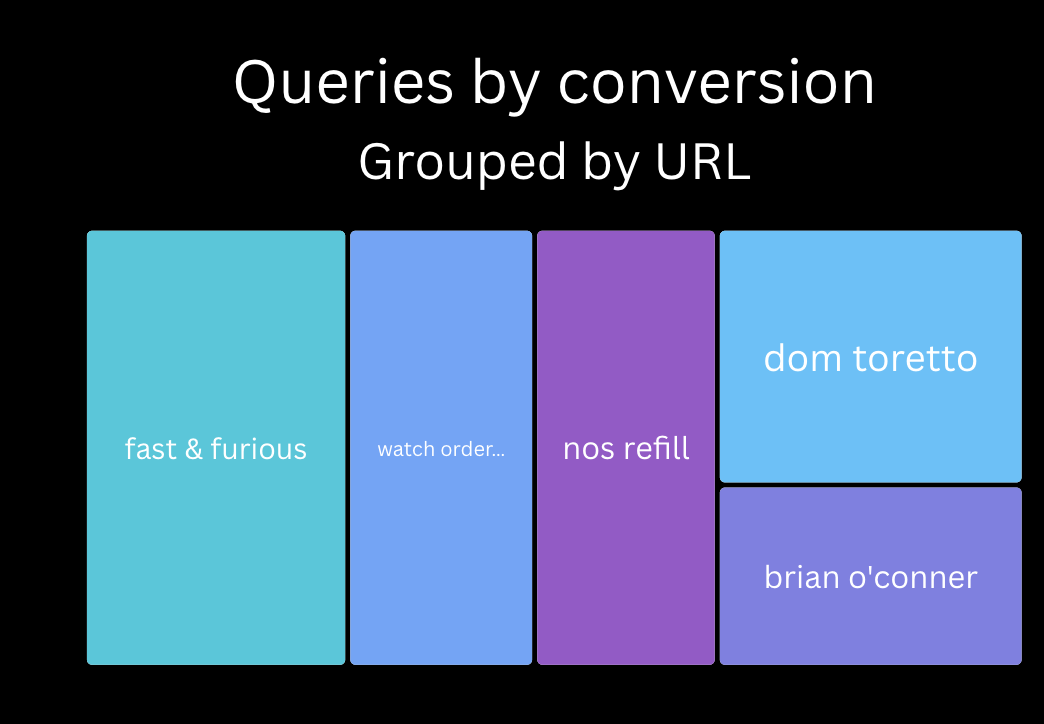
Queries by conversions (though needs to be grouped by URL)
Now, let's get into some AI
Inside Google Cloud, you can run Python notebooks. This allows you to manipulate the data even more and integrate with Vertex AI, Google Cloud’s AI system that powers Gemini. Here is some example code for determining the intent behind search queries using the Search Console data.
from vertexai.preview.generative_models import GenerativeModel
import vertexai
from google.cloud import bigquery
import pandas as pd
import re

vertexai.init(project="project-name", location="us-central1")
model = GenerativeModel("gemini-2.5-flash")


batch_size = 20
## Function to send batch to Gemini
def label_query_intents(queries):
    print("start labelling")
    prompt = f"""
    You are a JSON API.
    Group the following search queries into intent clusters.
    For each group, return:
    - "intent": short label (e.g., "Informational")
    - "description": short summary of user goal
    - "queries": list of original queries

    Return only a JSON array of objects — no explanation or intro text.

    Queries:
    {chr(10).join(f"- {q}" for q in queries)}
    """
    response = model.generate_content(prompt)
    raw_text = response.text.strip()
    clean_json = re.sub(r"^```(?:json)?\s*|\s*```$", "", raw_text, flags=re.MULTILINE)
    try:
        return json.loads(clean_json)
    except Exception as e:
       print(f"An error occurred: {e}")
       print("==============")
       return []

# # Loop through batches and collect labeled queries
results = []

for i in range(0, len(all_queries), batch_size):
    batch = all_queries[i:i+batch_size]
    groups = label_query_intents(batch)

    for group in groups:
        intent = group.get("intent")
        for query in group.get("queries", []):
            results.append({"query": query, "intent": intent})

# # Save to dataframe
df = pd.DataFrame(results)
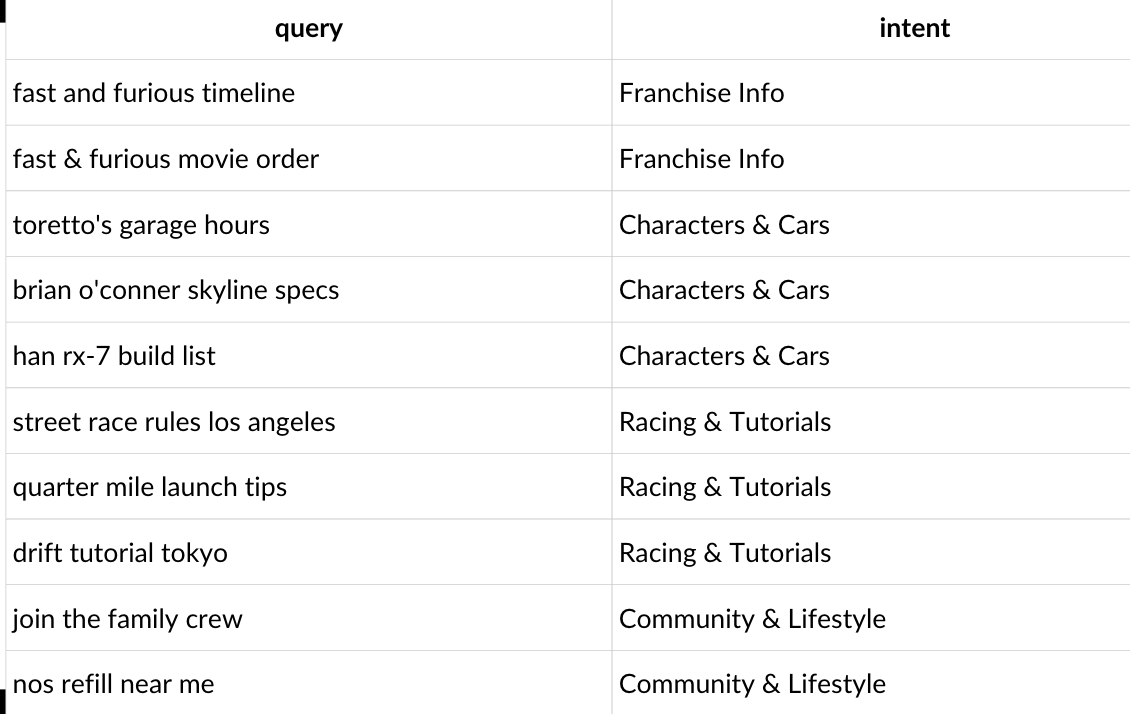
This gives you data like this:
Which allows you to show:
CTR based on intent

Average position based on intent

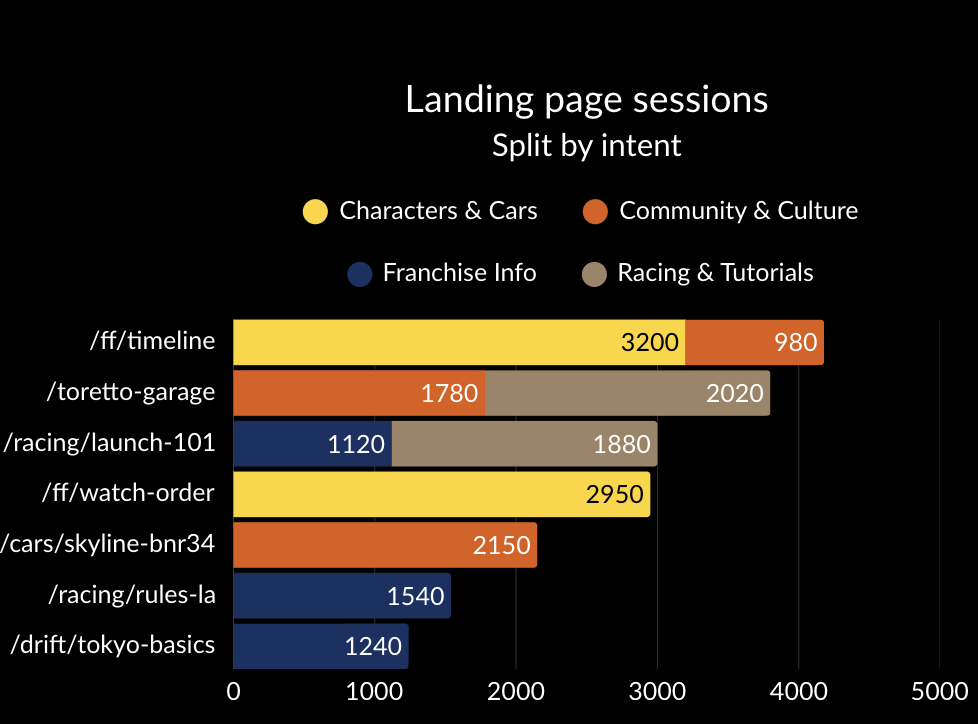
Landing page sessions based on intent
What's next?
If you want to learn more about Google Search Console and Big Query, check out an online course I have helped to create with a team of talented SEO and BigQuery people. https://bigquery.pro/